
How Google Really Makes Its Money | The Full FY2025 Financial Breakdown (Part 1)
Part 1 of the analysis will cover the Income Statement


Google (Alphabet) ended 2025 on a high. They wrapped up 2025 as the best-performing Big Tech company by stock appreciation.
In terms of their technological prowess, the public perception around them saw a significant shift, from being questioned as to why they got left behind in the AI race, to being recognized as having the best AI model. I have written about this in details previously.
So, it will be interesting to see what Google does in 2026, in order to keep their position as the best performer.
Here’s an analysis of Alphabet’s performance over FY2025, so that we get a better, quantitative understanding of their performance, beyond the media and marketing hype.
I’ll start with the Income Statement first.
1. Revenue Analysis
Let’s start with the top-line numbers. There was a 18% YoY increase (from $96.5 billion in Q4 2024 to $113.8 billion in Q4 2025) and a 11% QoQ increase (Revenues increased from $102.3 billion in Q32025).
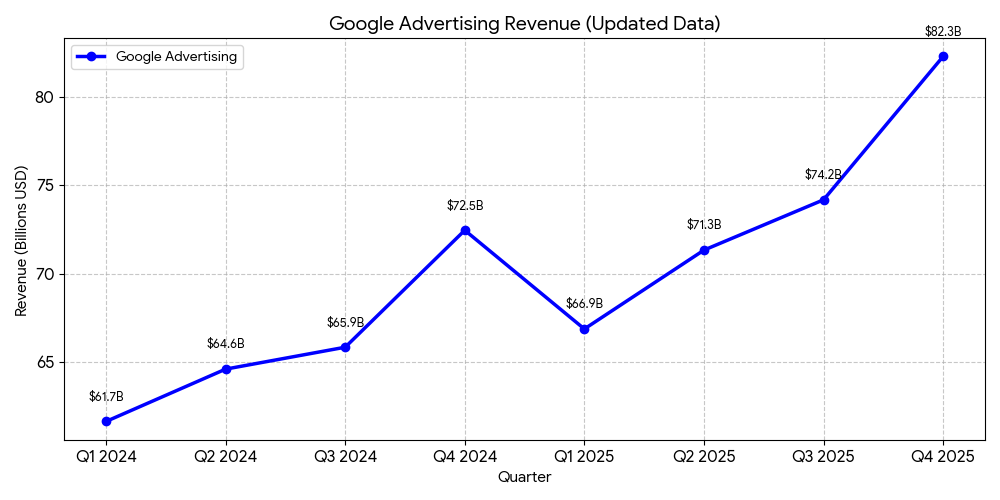
Now, you might be aware, if you follow Alphabet’s business, that revenues from advertisement make up the majority of their Total Revenues. But this is changing. In the next 2 charts below, you’ll see Revenue from Advertising having a downward slope. On the other hand, Revenues from cloud, driven by AI demands, is showing a consistent upward slope.
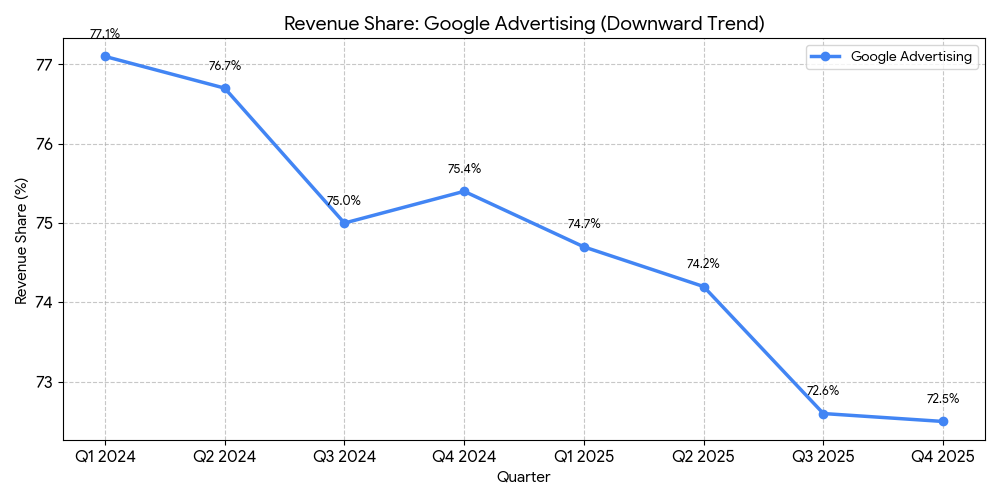
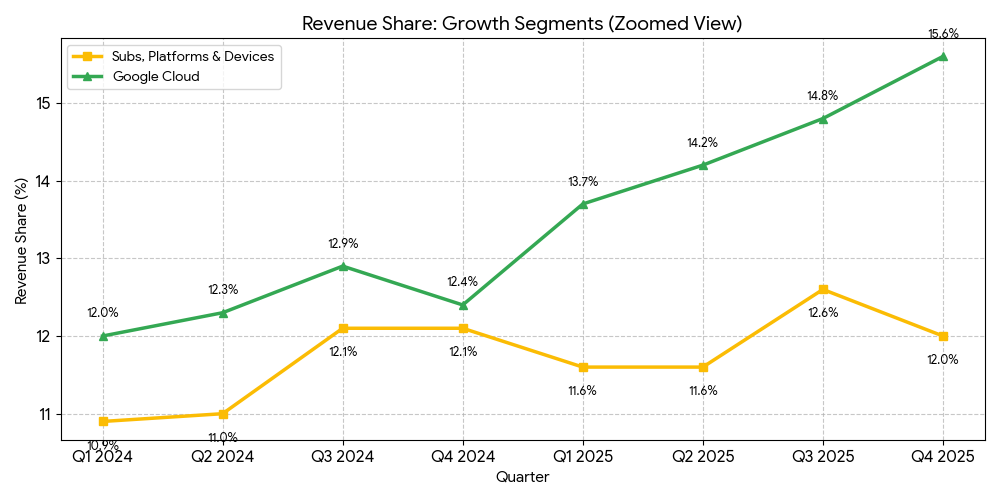
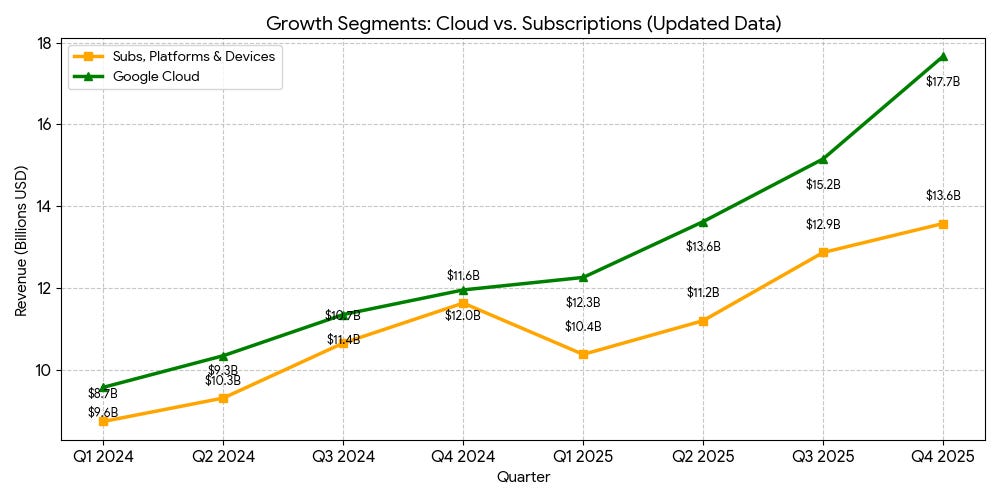
With all the CapEx (Capital Expenditures) on building AI Infrastructure, the question is whether its going to pay off? The growth in Revenues from Google Cloud shows that the investments are actually paying off.
In the next 2 images below, you’ll notice the Revenue from Google Cloud more than doubled over the past 2 quarters.
Now, let’s take a look at the QoQ growth trends of the Revenue, in the chart below.
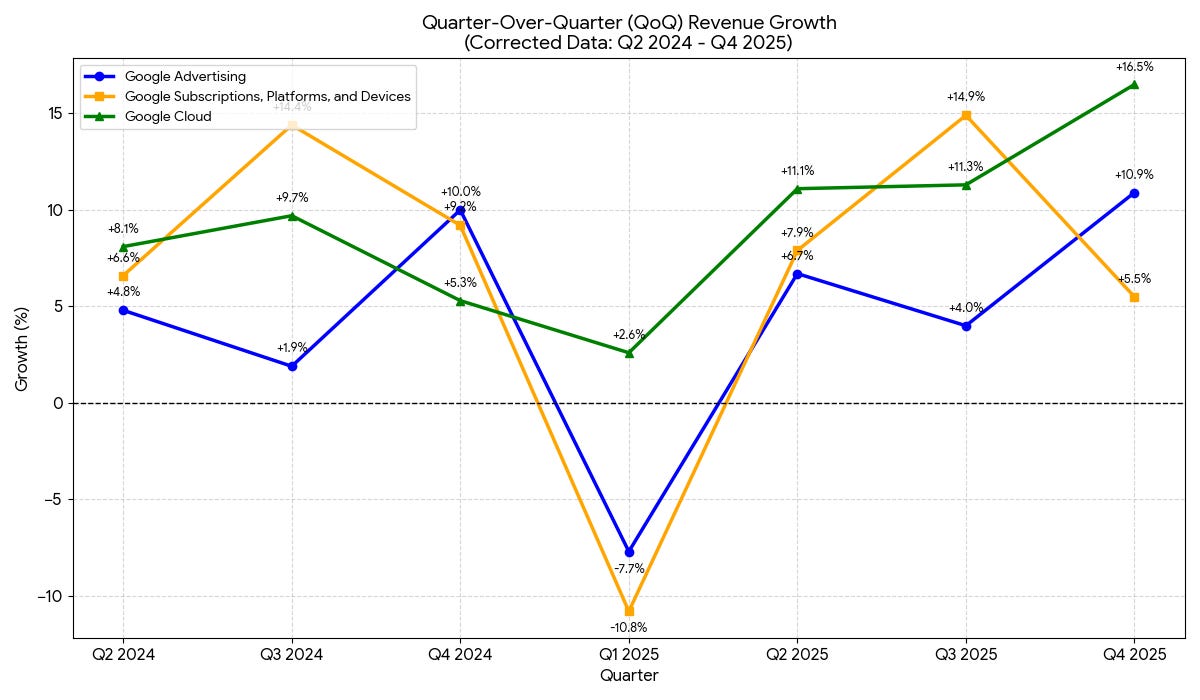
We can clearly observe that Google Cloud (Green) shows the most robust positive momentum. Unlike the other segments, it never dips into negative growth. It starts 2025 with modest growth (+2.6%) but accelerates significantly throughout the year, ending with a massive +16.5% jump in Q4 2025.
Both Advertising and Subscriptions show a clear seasonal pattern. They both drop significantly in Q1 2025 (negative growth) after a strong holiday season (Q4 2024).
Subscriptions, Platforms & Devices Volatility (Orange) is the most volatile, with sharp peaks (e.g., +14.9% in Q3 2025) and deep troughs (10.8% in Q1 2025), likely driven by hardware launch cycles.
2. Profit Margin Analysis
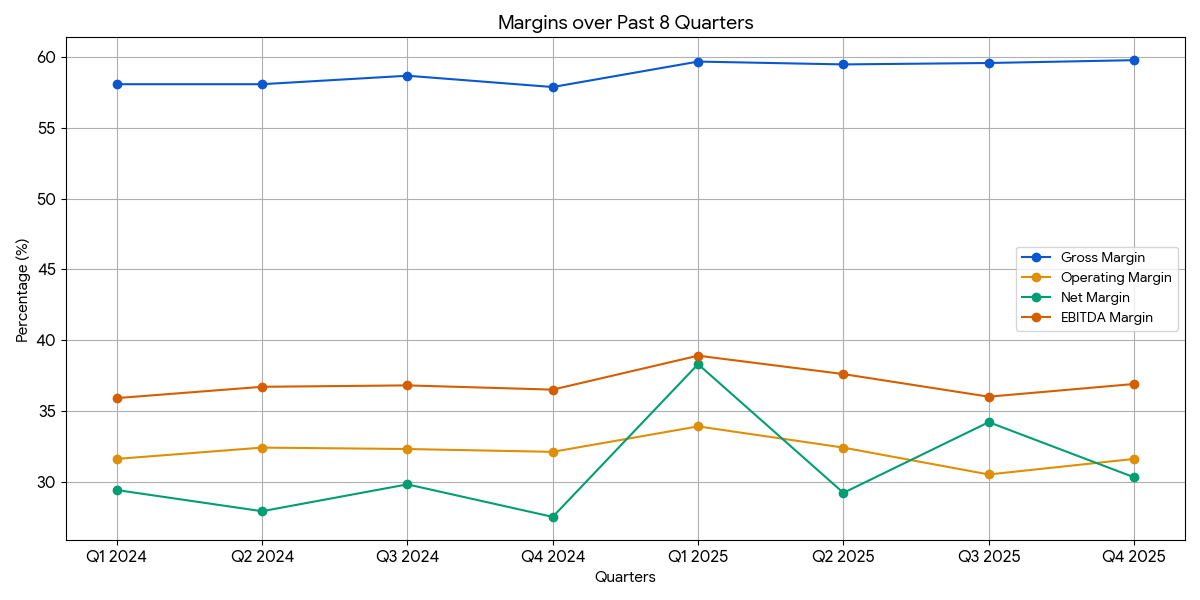
Now, let’s take a look at the 4 profit Margins: Gross Margins, Operating Margin, EBITDA Margin & Net Margin.
Observations and Insights
From the chart above, we can observe 2 things:
Upward trend in Gross Margin.
The gradual upward trend in Gross Margin (reaching ~60% by late 2025) is primarily driven by a improved efficiency in cloud infrastructure.
Cloud revenue surged (e.g., +48% YoY in Q4 2025), but the cost to deliver that revenue did not grow as fast. What this means is that the variable cost to serve additional customers is less than the Revenue generated by that customer. The high fixed costs of data centers are spread across more customers.
In the 10-k form for FY 2025, Management noted that growth was “led by an increase in Google Cloud Platform (GCP) across enterprise AI Infrastructure... as well as core GCP products”. The segment’s operating income grew significantly faster than its revenue, demonstrating that the high fixed costs of data centers are being spread over a larger revenue base.
Operating, EBIDTA & Net Margin are fluctuating within a small range.
While Gross Margin has been steadily ticking up, the other margins are volatile. But these volatility is due to specific “one-time” charges and non-operating financial activities rather than core business health.
Operating margin trends would have been similar to Gross Margin trends if not for massive, irregular expenses recorded in the past 2 quarters, such as the ones below:
Legal Fines: In Q3 2025, the operating margin dropped to 30.5%. This was directly caused by a $3.5 billion accrued fine from the European Commission. Excluding this fine, the Operating margin would have been 33.9% (30.5%). (The company accrued a $3.5 billion fine imposed by the European Commission regarding Google’s advertising technology business)
Waymo Compensation Charge: In Q4 2025, operating income was hit by a $2.1 billion employee compensation charge related to Waymo. This is a non-cash expense related to the valuation of Waymo stock following its investment rounds, creating a temporary drag on reported margins.
3. Expense Structure Analysis
Let’s now move on to expenses.
Here’s the Break down operating expenses as % of revenue
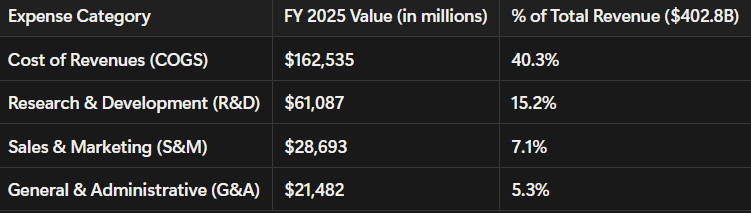
Total Operating Expenses (R&D + S&M + G&A): 27.6% of Revenue.
Observations & Insights
Cost of revenues (COR) remains the largest component.
One of the primary reasons why COR is high because The Cost of Revenues includes the energy and electricity costs required to run the data centers.
According to the 2025 Annual Report (Form 10-K), the “Cost of Revenues” specifically includes “other technical infrastructure operations costs,” which includes “Energy” among other components
Now, isn’t this a contradiction? Previously, we found out that the Gross Margins have been increasing over the past 8 quarters. How could that be, if Cost of Revenue is also increasing?
This is possible if Revenue is growing faster than Cost of Revenue. And that’s what the scenario is.
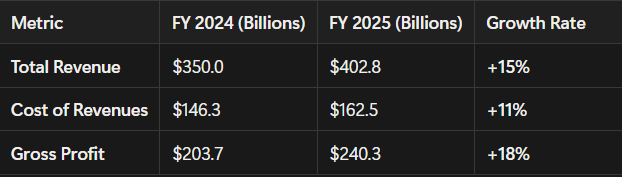
Even though Cost of Revenue grew by 11% YoY, the Total Revenue grew at an even higher rate by +15%. That’s the reason why Gross Profit, and hence gross profit is positive and showing an upward trend.
As I have already mentioned this in the Profit Margin Analysis section, this means that the variable cost to serve additional customers is less than the Revenue generated by that customer. The high fixed costs of data centers are spread across more customers.
4. Operating Leverage Analysis
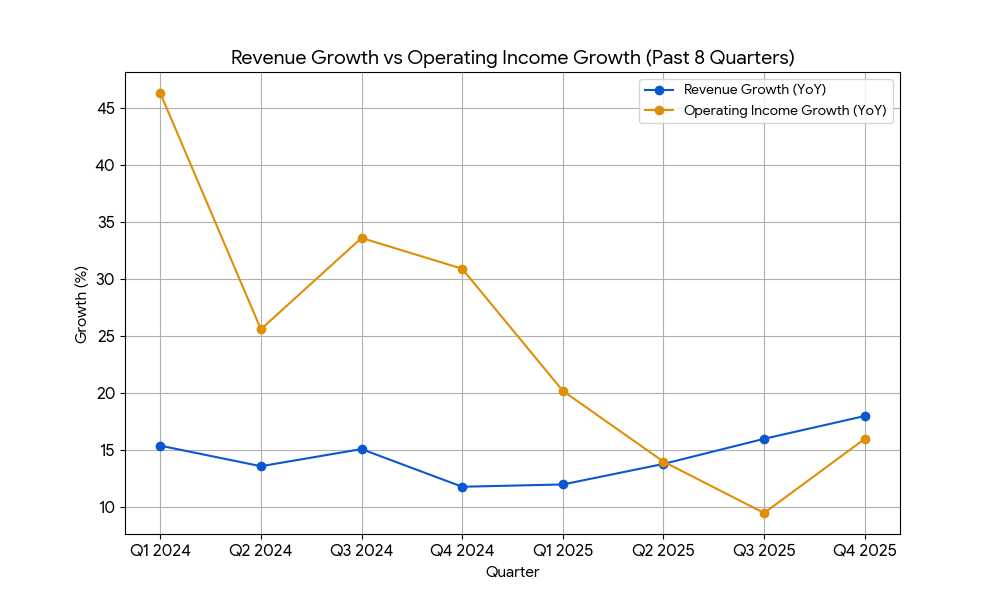
Here’s the trend of the Revenue Growth & Operating Income Growth over the past 8 quarters.
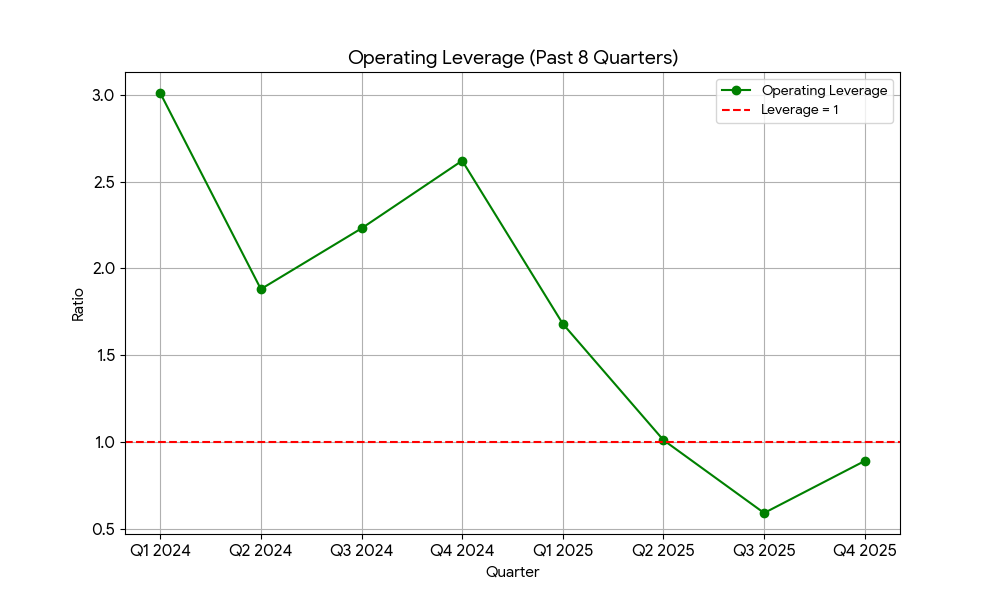
Here’s the Operating Leverage trend for the past 8 Quarters:
Observations
Over the past 8 Quarters, Revenue growth has an upward trend.
However, Operating Income growth has decreased over the past 8 quarters, from +46.3% in Q1FY24 to +16.0% in Q425
Operating Income growth has caused the Operating Leverage to follow a downward trend too, from 3 in Q12024 to less than 1 in Q42025
Insights (making sense of the Observations)
Now, this decrease in Operating leverage, driven by decrease in Operational Income growth, might make you ponder “Is declining leverage due to strategic investments or inefficiency?”
This decline is definitely not because of operational efficiency. Rather, the recent decline is due to 2 main reasons: strategic investments and one-time charges. The company spent $91.4 billion on capital expenditures in 2025 to build AI infrastructure. This created significantly higher depreciation costs (21.1 billion) that weigh on current profits.
Furthermore, reported leverage was artificially lowered by irregular expenses that I have already mentioned earlier (a $3.5 billion legal fine in Q3 and a $2.1 billion compensation charge for Waymo employees in Q4). Without these specific items, the company maintained strict discipline over its regular operating expenses.
…..
The most important question about AI it whether it will be profitable enough, given the massive investments needed. Stated in a more formal way, Does the AI infrastructure business model support high leverage potential?
The answer is Yes, the business model supports massive leverage potential. Once the expensive “fixed” costs (data centers and servers) are paid for, adding new customers costs very little, allowing profits to soar. Google Cloud’s Q4 2025 revenue grew 48%, but operating profit exploded by 154%. This confirms that as the company fills the capacity of its new AI infrastructure, profits will grow much faster than Revenue, demonstrating the inherent scalability of the model.
5. Net Profit (Bottom-line) Analysis
The following table summarizes the Revenue, Basic and Diluted EPS alongside their respective growth rates compared to the same quarter in the prior year (YoY).
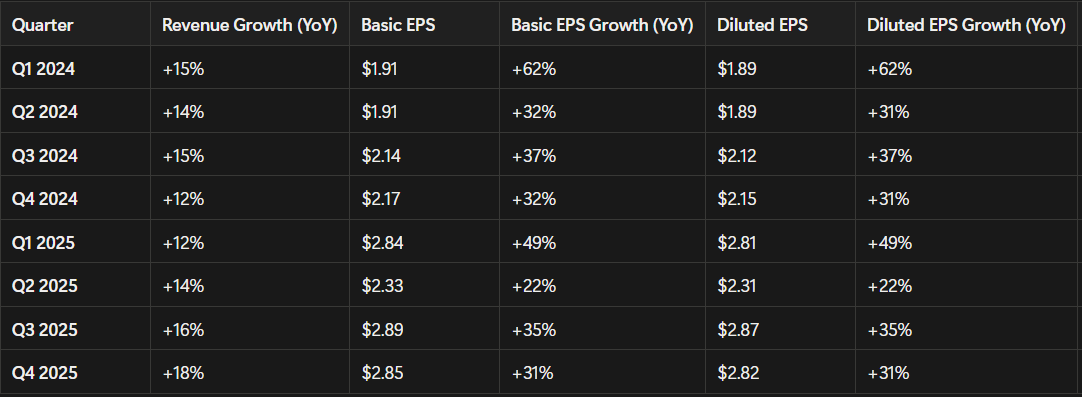
Across all eight quarters, we can observe that the EPS growth has consistently outpaced revenue growth, often by a multiple of 2x or more.
Revenue Trend: Revenue growth has remained steady, fluctuating between 12% and 18%.
EPS Trend: Earnings growth has been explosive, ranging from 22% to 62%.
…..
While profits growing faster than revenue positive for shareholders, such a large divergence often indicates that growth is being driven by non-operating factors or one-time events rather than core business leverage alone.
So, the question is, Is net income growing due to efficient operations or financial engineering?
The short answer is that it’s mostly due to Financial Engineering instead efficent operations.
The long answer is, the significant gap between moderate top-line growth and surging bottom-line earnings is driven by three primary factors:
Share Repurchases (Financial Engineering): Alphabet has aggressively bought back stock (e.g., 62.0 billion in 2024 and 45.4 billion in 2025). This reduces the “denominator” (share count), automatically boosting EPS even if net income stays flat.
Investment Gains (Non-Operating): Significant spikes in EPS, particularly in Q1 2025 (+49%) and Q3 2025 (+35%), were driven by massive unrealized gains on equity securities (e.g., an $8.0 billion gain in Q1 2025 and substantial gains in Q3).
What does this mean?
Alphabet (Google) acts like an investor. Besides selling ads and cloud services, it owns shares in other private companies (startups). In Q1 2025 and Q3 2025, the estimated value of some of these startups increased massively (by $8.0 billion in Q1 alone).
This is profit that exists only on paper.Accounting rules require Alphabet to list this increase in value as “income” immediately, even though they haven’t sold the shares or collected the cash.
Because this “paper money” is added to the company’s total profit for the quarter, the final profit number looks huge.
As a result, EPS (profit per share) jumped 49% in Q1 and 35% in Q3. This huge jump didn’t happen because Google sold 49% more ads or cloud services. It happened because their investment portfolio had a lucky quarter. Therefore, it doesn’t reflect “core operating efficiency” (how well they run their actual day-to-day business).
Final Insights from Income Statement Analysis
Positives
1. Diversification of Revenue
Even though Advertisement is still the largest share of revenue, we can observe diversification, especially through Google Cloud’s impressive growth.
2. Investments in AI infrastructure is paying off
The most immediate return on AI infrastructure investment is seen in the Google Cloud segment, where customers pay to use the very infrastructure (TPUs, GPUs, data centers) Google is building.
The payoff is visible in the 48% Cloud growth, the 154% Cloud profit jump, and the sustained 17% growth in Search. The infrastructure is not sitting idle. It is generating high-margin revenue faster than the company can build it, necessitating an even larger investment for 2026. (2026 CapEx guidance: $175 billion – $185 billion).
So, this concludes the analysis of Income Statement.